
Articles
- Page Path
- HOME > J Korean Acad Community Health Nurs > Volume 29(4); 2018 > Article
- Original Article Analysis of Spatial Distribution of Hypertension Prevalence and Its Related Factors based on the Model of Social Determinants of Health
-
Min Jung Kim
 , Nam Hee Park
 -
Journal of Korean Academy of Community Health Nursing 2018;29(4):414-428.
DOI: https://doi.org/10.12799/jkachn.2018.29.4.414
Published online: December 31, 2018
1Assistant Professor, Department of Nursing, Gyeongju University, Gyeongju, Korea.
2Associate Professor, Department of Nursing, Inje University, Busan, Korea.
: 
- 900 Views
- 14 Download
- 0 Crossref
- 0 Scopus
Abstract
PURPOSE
The purpose of this study is to identify the spatial distribution of hypertension prevalence and to investigate individual and regional-level factors contributing to the prevalence of hypertension in the region.
METHODS
This study is a cross-sectional research using the 2015 Community Health Survey. Total 64,473 people from 7 metropolitan cities were used for the final analysis. Geoda program was adopted to identify the regional distribution of hypertension prevalence and analyzed by descriptive statistics, one-way ANOVA and correlation analysis using SPSS statistics 23.0 program. Multi-level analysis was performed using SPSS (GLMM).
RESULTS
The prevalence of hypertension was related to individual level factors such as age, monthly household income, normal salt intake, walking practice days, and regional level factors including number of doctors per 10,000 population, number of parks, and fast food score. Besides, regional level factors were associated with hypertension prevalencies independently without the effects of individual level factors even though the influences of individual level factors ware larger than those of regional factors.
CONCLUSION
Respectively, both individual and regional level factors should be considered in hypertension intervention programs. Also, a national level research is further required by exploring various environmental factors and those influences relating to the hypertension prevalence.
| J Korean Acad Community Health Nurs. 2018 Dec;29(4):414-428. English. Published online Dec 26, 2018. https://doi.org/10.12799/jkachn.2018.29.4.414 | |
| © 2019 Korean Academy of Community Health Nursing | |
|
Min Jung Kim | |
|
1Assistant Professor, Department of Nursing, Gyeongju University, Gyeongju, Korea. | |
|
2Associate Professor, Department of Nursing, Inje University, Busan, Korea. | |
Corresponding author: Park, Nam Hee. Department of Nursing, Inje University, 75 Bokji-ro, Busanjin-gu, Busan 47392, Korea. Tel: +82-51-890-6832, Fax: +82-51-891-6832, | |
| Received May 01, 2018; Revised September 27, 2018; Accepted September 28, 2018. | |
|
This is an Open Access article distributed under the terms of the Creative Commons Attribution Non-Commercial License (http://creativecommons.org/licenses/by- | |
|
Abstract
| |
|
Purpose
The purpose of this study is to identify the spatial distribution of hypertension prevalence and to investigate individual and regional-level factors contributing to the prevalence of hypertension in the region.
Methods
This study is a cross-sectional research using the 2015 Community Health Survey. Total 64,473 people from 7 metropolitan cities were used for the final analysis. Geoda program was adopted to identify the regional distribution of hypertension prevalence and analyzed by descriptive statistics, one-way ANOVA and correlation analysis using SPSS statistics 23.0 program. Multi-level analysis was performed using SPSS (GLMM).
Results
The prevalence of hypertension was related to individual level factors such as age, monthly household income, normal salt intake, walking practice days, and regional level factors including number of doctors per 10,000 population, number of parks, and fast food score. Besides, regional level factors were associated with hypertension prevalencies independently without the effects of individual level factors even though the influences of individual level factors ware larger than those of regional factors.
Conclusion
Respectively, both individual and regional level factors should be considered in hypertension intervention programs. Also, a national level research is further required by exploring various environmental factors and those influences relating to the hypertension prevalence. |
|
Keywords:
Social determinants of health; Hypertension; Prevalence; Urban population
|
|
|
INTRODUCTION
|
1. Background
Hypertension is a disease with a high disease burden in Korea and a preceding disease of cerebrovascular diseases, which are a major cause of death, and the prevalence rate and medical costs of hypertension have been steadily increasing along with those of diabetes [1]. It is also the disease with the highest medical costs as a single disease [2]. Globally, it is estimated that 54% of strokes and 47% of ischemic heart diseases are associated with hypertension [3]. On the other hand, in Korea, the experience rate of lifetime diagnosis of hypertension in people aged 30 or older was 14.5~28.1% according to the Community Health Survey Data from 2008 to 2015, and the median of the regional distribution in the regional units of municipalities (si (city) /gun (county)/gu (district)) has been steadily increasing since 2008 from 18.6% in 2010 to 19.4% in 2015[2]. Especially in Seoul and six Metropolitan Cities, hypertension prevalence has been increasing every year from 13.78% in 2009 to 14.90% in 2013, and the prevalence of hypertension has been reported to be much higher compared to those of other diseases [4]. Urban areas are densely populated districts, and studies of the relationship of urban environments with obesity, asthma, and heart disease have been recently increasing, and the need for creation of healthy urban environments has been emphasized [5]. In particular, in the Seoul Special City and six Metropolitan Cities, urban environments have been reported to have a significant negative impact on health, and the healthcare and medical expenses are being greatly increased. Therefore, there is a need to elucidate the regional factors related to hypertension prevalence.
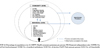
Factors associated with chronic diseases include individual factors such as demographic and socioeconomic factors [3, 6, 7], disease-related factors [8] and health behavior factors [9, 10, 11, 12, 13, 14]. A representative example of the theories that approached the determinants of health from an ecological perspective is Dahlgren and Whitehead's model of the social determinants of health [15]. This theory presents four layers (levels) of determinants of health surrounding individuals, such as individual lifestyle factors, social and community networks, living and working conditions, and socioeconomic, cultural, and environmental conditions as the factors that affects health status. According to this theoretical model, individuals have invariable sets of genes and are at the center of the layers and there are four different layers of influences around individuals which affect health and are changeable. This ecological approach to health behaviors brings attention to environments and policies, and emphasizes the need to consider influences at multiple levels by taking a comprehensive approach by integrating the sociopsychological, organizational, and environmental factors at the regional level with the context of the individual-level behaviors [16].
When the risk factors for hypertension are classified according to the model of the social determinants of health proposed by Dahlgren and Whitehead [15], individual-level factors include lifestyle factors such as smoking, drinking, drug abuse, the lack of physical activity, and poor diet [7, 17, 18, 19]. In recent studies, regional-level factors have also been identified as factors affecting hypertension [20, 21, 22, 23, 24, 25]. Specifically, the percentage of the beneficiaries of the National Basic Livelihood Security System, which reflects the income level of the region [20], the population density, and the rate of land use mix were inversely associated with hypertension prevalence [21]. In addition, hypertension prevalence was higher in people with health insurance than in those without health insurance, and it was also higher in people living in urban areas than in those living in rural areas [23, 25]. Moreover, hypertension prevalence was found to be high among people living in the regions with a low financial independence rate and in the areas where it is difficult to use parks and bicycle roads frequently [12], and hypertension prevalence was higher among people with the experience of using a healthcare institution [22]. In addition, it has been reported that there is a difference in the mortality rate of cerebrovascular diseases [26], depending on the geographical characteristics of regions, such as coastal areas, tourist attractions, and urban core areas [26]. To date, no studies have analyzed the relationship between hypertension and regional-level factors such as the regional Sprawl Index (residential density) and urban infrastructure, land use status, park accessibility. However, it has been reported that uniform land uses and discontinuous walking environments influenced the level of obesity in individuals [27], and that an increase in the number of parks resulted in increased physical activities and a lower level of obesity [5]. The lack of parks or bicycle roads has been shown to increase the lack of physical activity in individuals, contributing to the increase of the incidence of obesity, diabetes and cardiovascular diseases [27]. Considering these study results, it is believed that if facilities such as parks and pedestrian passages are placed near residential areas and work places when urban development proceeds, it will increase the mixture of land use and facilities such as bicycle roads and pedestrian passages used to go to parks, residential and office areas are expected to provide exercise effects and serve as a regional environmental factor which can contribute to the reduction of hypertension prevalence. Therefore, it is necessary to identify the regional-level factors of hypertension.
So far, some studies have analyzed the differences in the prevalence of hypertension and the trends of annual changes in small regional units such as eups, myeons, and dongs using the national statistical data of Korea, and some research has used an ecological analysis to conduct the analysis of correlations between health behavior variables and variables related to regional characteristics and spatial analysis [20]. However, no prior studies have carried out a multi-level analysis to stratify and estimate the characteristics of individual-level factors and regional-level factors [5]. In addition, there is still a lack of studies which has visualized the regional distribution of prevalence of hypertension, has represented the differences in the prevalence due to the spatial specificity of the region, and has identified and analyzed regional variables [20, 28].
Therefore, this study aimed to investigate indivdual-level factors and regional-level factors related to the prevalence of hypertension based on Dahlgren and Whitehead's model of the social determinants of health (Figure 1). A multilevel analysis study was conducted to visualize the spatial distribution of prevalence using Geographic Information System (GIS) in consideration of variables of individual characteristics and characteristics of urban areas, and to identify multi-level factors in Seoul Metropolitan City and 6 metropolitan cities, which are regions with high hypertension prevalence. In addition, we attempted to clarify the relationship between individual-level factors and regional-level factors of hypertension in order to help to establish hypertension management project plans.
|
2. Purpose
The aim of this study was to investigate the current status of hypertension prevalence in Seoul and 6 metropolitan cities (si (city), gun (county), and gu (district)) and identify individual-level and regional-level factors influencing hypertension prevalence in each region (si, gun, and gu) using Dahlgren & Whitehead's model of the social determinants of health. The specific objectives of this study are as follows:
to investigate the distribution of hypertension prevalence by si(city), gun(county), and gu(district) in the region;
to examine hypertension prevalence according to individual-level and regional-level factors;
to identify the individual-level and regional-level factors of hypertension prevalence.
|
METHODS
|
1. Study Design
This study is a cross-sectional study to investigate the individual-level and regional-level factors related to hypertension prevalence through an ecologic analysis based on Dahlgren and Whitehead's model of the social determinants of health, and it was conducted by secondary data analysis.
2. Participants and Data Collection
The spatial scope of the research was limited to Seoul and 6 metropolitan cities in order to identify the regional characteristics of urban environments. The analysis units were city (si), county (gun), and district (gu), and the temporal scope was set as the year of 2015 when the Community Health Survey was conducted. The collected data were divided into the data of individual-level and regional-level factors in order to analyze individual-level and regional-level factors related to the prevalence of hypertension. For the data of individual-level factors, out of 67,708 respondents residing in Seoul and 6 Metropolitan Cities among a total of 228,558 respondents of the 2015 Community Health Survey, 64,373 people were included in the final analysis, excluding the missing data of 3,236 people. The data of regional-level factors include the 2015 population statistics based on resident registration provided by the Ministry of Government Administration and Home Affairs, the 2015 Cadastral Statistics of the Ministry of Land, Infrastructure, and Transport, 2015 Statistics of Utilization of Medical Services by Region provided by the National Health Insurance Corporation, the 2015 Local Government Integrated Financial Overview provided by the Ministry of Government Administration and Home Affairs, the 2015 Statistics of Urban Planning provided by the Korea Land and Housing Corporation, the data of 74 municipalities (si (city), gun (county), gu (district)) from the 2015 Business Survey (statistics of cities and counties), and the 2015 maps of municipalities provided by the Statistical Geographic Information Service of the Korean National Statistical Office as cadastral data.
3. Selection of Variables
The variables of individual-level and regional-level factors affecting hypertension prevalence in the regions (si/gun/gu) were selected based on previous studies such as Lee [21], Kim and Kang [28], and Ewing [15].
1) Dependent variables
The experience rate of lifetime diagnosis of hypertension from the Community Health Survey that standardized the regional prevalence of hypertension by age and gender was used as the index of hypertension prevalence. The prevalence rate was the directly standardized rate using the weighted average prevalence of the standard polulation, which was calculated by multiplying the prevalence rates by gender and age by the standard population ratio of each section [2].
2) Independent variables
Gender, age, the number of household members, and average monthly household income from the data of the 2015 Korea Community Health Survey were selected as the demographic and socioeconomic variables [6, 7, 14]. Based on previous studies, variables such as smoking status [12], the level of alcohol consumption at a time [4], usual level of salt intake [18], and walking practice day a week [5] were included as health behavior variables.
Based on the results of previous research [12, 21], the percentage of population aged 65 or older, population density, the health insurance premium per person and the financial independence rate were selected as the demographic and socioeconomic variables of regions. The number of healthcare institutions per 10,000 population and the number of physicians per 10,000 population, which can well represent the characteristics of the delivery of healthcare services, were selected as the characteristics of the regional delivery of healthcare services. In addition, the number of parks, the park area per person, the number of bicycle roads, extension of bicycle roads, the number of fast food restaurants were selected as the variables of physical environment characteristics of the region [5, 21].
4. Data Analysis
To investigate the regional differences in hypertension prevalence, we used GeoDa software to examine the spatial distribution, and a multi-level analysis was performed using SPSS V.23 GLMM. First, we represented the hypertension prevalence of each of 74 autonomous regions with a diagram to examine the differences in hypertension prevalence. Secondly, descriptive statistics such as percentages and averages of individual-level factors and regional-level factors of hypertension prevalence were analyzed. Third, the relationship between individual-level and regional-level factors affecting prevalence of hypertension was analyzed using one-way ANOVA and Pearson's correlation coefficient. Finally, a multi-level analysis was conducted to analyze the effects of individual-level and regional-level factors on hypertension prevalence.
The analysis of individual data in this study may be subject to ecological fallacy because of regional data and the hierarchical or nested structures if analysis is performed using a general linear regression model [5], and it is difficult to reflect the spatial heterogeneity of uneven and diverse distributions of the participants's data among spatial units [5]. For this reason, we used a multi-level model that stratifies and characterizes the respective characteristics of individual-level and regional-level factors [21]. Because the prevalence of hypertension (diagnosis of hypertension) in individuals used as a dependent variable has a binomial distribution, the two-level multilevel logistic regression model, in which a variable is converted into a linearized dependent variable using a link function, was selected. A random intercept model by which the random effect for the intercept of the regions and fixed effects for controlled independent variables can be estimated was constructed.
5. Ethical Considerations
This study was conducted after obtaining approval from the IRB of the Inje University (approval number: IRB No. INJE201608017003-UE002) for ethical considerations for the participants and data utilization.
|
RESULTS
|
1. Regional Distribution of Hypertension Prevalence by Si/Gun/Gu (City/County/District)
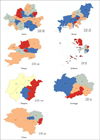
The mean prevalence of hypertension in 74 municipalities including cities, counties, and districts comprising Seoul and 6 metropolitan cities was 19.1% in 2015 (Table 1). In the map, the regions were divided into 4 groups based on the quintiles, and the status of hypertension prevalence by region was visualized by using GIS (GeoDa software). Darker colors indicate higher prevalence of hypertension. The distribution of hypertension prevalence in Seoul showed a clear difference between Gangnam areas and Gangbuk areas. The districts with the highest prevalence are concentrated in Gangbuk areas; in other words, the districts with the first to third highest prevalence of hypertension are Jungnang-gu (23.5%), Seodaemun-gu (22.7%) and Eunpyeong-gu (22.2%). On the other hand, the districts with the first to third lowest prevalence are Gangnam-gu (16.2%), Seocho-gu (16.3%) and Yeongdeungpo- gu (17.2%), so the districts with the lowest prevalence are mostly concentrated in Gangnam regions. In Busan, it can be seen that the regions with the first to fourth lowest prevalence of hypertension are adjacent to each other, and there are large differences among the regions. In Daegu, the regions with the first to third highest prevalence of hypertension are adjacent to each other. In Incheon, the county areas where there are many island areas mostly showed high prevalence rates. Even in Gwangju, Daejeon, and Ulsan, the prevalence rate varies according to regions(Figure 2).
|
|

2. Analysis of Individual-level and Regional-level Factors Affecting Hypertension Prevalence
1) Individual-level factors
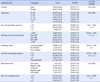
Table 2 shows the general characteristics of the participants. Males were 46.0% and females were 54.0%. As to the number of household members, the households with 3~5 household members accounted for the largest proportion (59.8%). Regarding the average monthly household income in the past one year, the largest proportion of the respondents (31.7%) earned 3 to less than 5 million won monthly, and 13.2% of the respondents earned less than 1 million won. As for smoking status, 17.0% of the respondents smoked every day and 1.9% of them smoked occasionally. Regarding the level of alcohol consumption at a time, the rate of people drinking 5 glasses or more was highest (31.1%). For the usual sodium intake, people eating insipid foods accounted for 25.2% and those eating salty foods were 25.2%. For the number of days of walking for at least 10 minutes at a time a week in the past one week, the rate of those who practice walking 6 days or more was the highest (47.2%).
|
2) Regional-level Factors
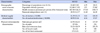
The average percentage of older people aged 65 or older was 13.40±3.85%, the average population density was 10,348±7,105 persons (total number per 1,000 population), and there was a high standard deviation regarding regional differences, indicating that there was a large difference in the population density among regions. The average health insurance premium per person was 847,800 won, ranging from a minimum of 575,830 won to a maximum of 1583,750 won. The financial independence rate was 28.92±12.77% on average, and only 7 out of 74 regions were found to have the financial independence rate of more than 50%. The number of healthcare institutions per 10,000 persons and the number of physicians per 10,000 persons were 10.95±5.36 and 31.29±31.72, respectively. The average park area per person was 12.95±26.52 m2, and there were significant regional differences of up to 157.19 m2. The average number of parks was 87±56. The average length of the extensions of bicycle roads was 53.53±58.79 km and the average number of bicycle roads was 26±24. The average number of fast food restaurants was 271±121, ranging from a minimum of 17 to a maximum of 577 (Table 3).
|
3. Individual-level and Regional-level Factors Affecting Hypertension Prevalence
1) Individual-level factors affecting hypertension prevalence
There was a statistically significant difference in hypertension prevalence according to age, the number of household members, monthly household income, smoking status, the level of alcohol consumption at one time, the number of walking practice days a week among the variables of individual-level factors, and other variables did not have a statistically significant effect (p<.05). Specifically, as age became higher, the prevalence of hypertension rose (t=2.36, p=.003), and hypertension prevalence was higher in people with less than 3 household members than in those with 6 or more household members (t=7.43, p<001). As to monthly household income, hypertension prevalence was higher in people earning less than 1 million won a month compared to those earning 3 to 2.99 million won and those earning 5 million won or more (t=53.68, p<.001). Regarding smoking status, hypertension prevalence was higher in the people smoking everyday than in non-smokers (t=20.69, p<.001). As for the level of alcohol consumption at a time, the prevalence rate was significantly higher in people drinking 1 to 2 glasses at a time (t=54.30, p<.001). Regarding the number of walking practice days a week, the prevalence rate was significantly higher in people who practice walking less than 3 days a week than in those who practice walking 6 days or more a week (t=8.61, p<.001) (Table 2).
2) Regional-level factors affecting hypertension prevalence
The analysis of the correlation between regional-level factors and the prevalence of hypertension showed that hypertension prevalence was significantly negatively correlated with the number of healthcare institutions in the region (r=−.28, p<.05), the number of physicians (r=−.29, p<.05), the number of parks (r=−.31, p<.01), and the number of fast food restaurants (r=−.25, p<.05). There was a negative correlation between the park area per person and hypertension prevalence (r=−.21), but it was not statistically significant (Table 3).
4. Multilevel Analysis of Factors related to Hypertension Prevalence
To conduct a multi-level analysis, the Null model, the model of individual-level factors (Model 1), and the model of individual-level/regional-level factors (Model 2) were sequentially tested.
1) Null model
Without entering independent variables, the regional variance of the dependent variable, hypertension prevalence, was analyzed and whether there were regional differences in hypertension prevalence was tested (Table 5). In terms of the fixed effect, the estimated value for the mean value of log multiplication of hypertension in all the regions was −1.36 and the probability of hypertension was 1/(1+exp (1.36))=.423, which was statistically significant (p<.001). The variance at level 2 indicating the difference in hypertension prevalence among regions was statistically significant (µ0j=.048, p<.001), so it was shown that there are regional differences in the prevalence of hypertension. The intraclass correlation coefficient (ICC) value was 0.0143 (.048 /(.048 + 3.29), so the variance for regional-level factors accounted for 1.43% of the total variance, and this means that regional-level factors explain about 1.43% of hypertension prevalence. In other words, hypertension prevalence is different among regions, so it is necessary to conduct a multi-level analysis to estimate the effects of regional-level variables.
|

2) Model of Individual-level factors (Model 1)
The regression model to verify the regional differences in hypertension prevalence by entering the explanatory variables of Level 1 (personal level factor) is presented below as Model 1 (Table 5).
Model 1
log (diagnosed=1/undiagnosed=0)=β1AGEij + β2NOHij + β3INCOMEij + β4SMOKINGij + β5ALCOHOLij + β6SALTij + β7WALKINGij
The results of the analysis of the fixed effect of Level 1 (individual-level factors) on hypertension prevalence showed that hypertension prevalence was higher than in people aged 61 or over than in other age groups. Compared to the 19~30 age group, the odds ratio for hypertension prevalence was increased in the order of the 31~40 age group, the 41~50 age group, the 51~60 age group, and the 61 or over age group. With regard to the monthly household income, compared to the monthly household income of 5 million won or more, hypertension prevalence was increased in the order of 3 to 4.99 million won, 2 to 2.99 million won, 1 to 1.99 million won, and less than 1 million won, so monthly household income was found to be inversely associated with hypertension prevalence. For the level of alcohol consumption at a time, alcohol consumption of 5 or more drinks (in glasses) showed a positive effect on hypertension prevalence, and alcohol consumption of 1 to 2 drinks showed a negative effect on hypertension prevalence. Excessive drinking of 5 or more drinks was found to be a factor increasing hypertension prevalence, compared to no alcohol consumption. Regarding the level of daily salt intake, low-salt preference had a negative effect on hypertension prevalence. As for walking practice days per week, hypertension prevalence was found to decrease in people who practice walking 6 days or more a week compared to those who practice walking 2 days or less a week, demonstrating that the higher the number of walking practice days, the lower hypertension prevalence. On the other hand, with respect to the random effect, after explaining hypertension prevalence by entering independent variables of individual-level factors, the variance of regional-level factors was 0.016, which was statistically significant (p<.001), and ICC was calculated to be 0.0048 (.016/(.016 + 3.29)). Even after controlling for the characteristics of the individual-level factors, 0.48% of the variance of the regional-level factors remain unexplained. Therefore, in order to explain the regional differences, it is necessary to consider a model in which explanatory variables of regional-level factors were entered additionally.
3) Model of Individual-level/Regional-level Factors (Model 2)
Model 2
β0j=γ00 +γ1AGEij +γ2NOHij +γ3INCOMEij +γ4SMOKINGij + γ5ALCOHOLij + γ6SALTij + γ7WALKINGij + γ8NOMIij + γ9NODij + γ10NOPij + γ11PAPPij + γ12BREij + γ13NOBRij + γ14NOFFRij + µ0j
In Model 2, individual-level independent variables and regional-level independent variables were entered at the same time, and the effects of organization-level variables were tested while controlling for individual-level factors (Table 5). The fixed effects of Level 2 (individual-level/ regional-level factors) for hypertension were analyzed. As a result, in terms of individual-level factors, individuallevel factors except for the number of household members and smoking status were found to be factors related to hypertension. In terms of age, the odds ratio for hypertension was found to be increased in the order of the 31~40 age group, the 41~50 age group, the 51~60 age group, and the 61 or over age group, compared to the 19~30 age group. Especially in people aged 41 or over, hypertension prevalence was about 21 to 57 times higher. As in the results of Model 1, the average monthly household income was inversely related to hypertension prevalence. Regarding the level of alcohol consumption at a time, compared to no alcohol consumption, 5 or more drinks had a positive effect on hypertension prevalence, while one to two drinks had a negative effect, so excessive drinking of 5 or more drinks was shown to be one of the factors positively associated with hypertension prevalence. As for the usual level of salt intake, low salt preference had a negative effect on hypertension prevalence. In the case of the number of walking practice days a week, hypertension prevalence was found to be lower in people who practice walking 6 or more days a week compared to those who practice walking 2 days or less a week. This shows that the higher the number of walking practice days, the lower hypertension prevalence. In terms of regional-level factors, hypertension prevalence was significantly increased in the regions with 30~50 physicians and those with less than 30 physicians
in ascending order compared to the regions with 50 physicians per 10,000 people, so it was found that as the number of physicians is decreased, hypertension prevalence tends to be increased. Regarding the number of parks, hypertension prevalence is likely to be higher in the regions with 50~100 parks and in the those with less than 50 parks, compared to the regions with 100 parks, so it was shown that as the number of parks is lower, hypertension prevalence is increased. As to the number of bicycle roads, hypertension prevalence was found to be statistically significantly higher in the regions with 15~35 bicycle roads and those with less than 15 bicycle roads compared to the regions with 35 bicycle roads. Finally, regarding the number of fast food restaurants, the prevalence of hypertension was found to be 1.2 times higher in the regions with 100 restaurants or less than in the regions with 200 restaurants or more. In terms of the random effects, when the variables of the regional-level factors were added and the variance at the organizational level was reduced to 0.013, and it was statistically significant (p<.001). ICC was calculated to be 0.0039 (.013/(.013 + 3.29)). The variance of regional-level factors accounted for 0.39% of total variance. It was still statistically significant after controlling for the characteristics of the individual-level and regional-level factors (p<.001), and 0.39% of the variance of regional-level factors was left unexplained.
|
DISCUSSION
|
1. Spatial Distribution of Hypertension Prevalence
The study results of this study showed that there are regional differences in hypertension prevalence, which ranged from 15.0 to 24.4% with an average of 19.1%. In fact, the distribution of hypertension prevalence was greatly different among regions within the same Metropolitan City. These results suggest that the prevalence of chronic diseases such as hypertension varies according to the physical and socioeconomic environments of the regions where individuals are residing as well as the health behaviors of individuals. In this respect, there is a need for an approach of attempting to conduct interventions for each small regional unit if the prevalence is continuously high in a specific region by analyzing the factors related to the regional imbalance using the data of sub-municipalities (eup (town), myeon (township), dong (neighborhood)). In addition, if the same regional environment is shared within the same living sphere, accessibility to the local physical environments such as park environments or bicycle roads where physical activity can be performed or accessibility to public healthcare services affecting hypertension provided in the local community may be different. In other words, the prevalence of chronic diseases such as hypertension may be different depending on which local community individuals belong to [29]. In fact, a previous study analyzed of the causes of the health status of submunicipalities (eup/myeon/dong) in 16 municipalities (gu/gun) of Busan using health status indicators and reported that health behaviors related to chronic diseases and health status indicated by health status indicators were poorer in the regions with a lower socioeconomic level and that regions with a low level of health status were often adjacent [26].
As described above, it has been found that the prevalence rate of chronic diseases is different according to the spatial specificity of the region, and there are differences depending on the regional variables [20, 28]. For these reasons, there is a need for research to identify regional-level factors related to hypertension prevalence through spatial analysis that reflects the spatial dependence, which is a unique geographical feature of space. Spatial autocorrelation reflects spatial dependence in space, and spatial similarity is more likely to occur as the areas are closer as a result of living in the same region if the social or economic situation or level of the individuals is similar [30]. In this study, Moran's I analysis, which reflects spatial autocorrelation, showed that there was almost no autocorrelation. Basically, in spatial analysis, when all regions of the country are included in the study, it is possible to examine the factors related to the distribution of a specific area through the spatial analysis procedure. However, in this study, only Seoul and six Metropolitan Cities were included in the analysis and the regions were separated from each other, and this seems to be the reason there was no spatial autocorrelation. It is considered necessary to investigate differences in the influencing factors among regions in a future study encompassing all the regions of the country.
2. Individual-level Factors Affecting Hypertension Prevalence
The individual factors related to hypertension prevalence were age, monthly household income, the level of alcohol consumption at a time, and walking practice days a week. In other words, hypertension prevalence was higher in people aged 61 or older, in those with lower monthly household income, in those having 5 or more drinks at a time, and in those who practice walking less than 6 days a week. This is consistent with previous studies which confirmed that sociodemographic factors and lifestyle factors such as exercise and drinking are major risk factors influencing hypertension prevalence [7, 17, 18, 19, 22]. Hypertension prevalence is generally higher in people aged 60 years or older than in other age groups [7, 14]. Jang et al. [13] analyzed the data from the 4th Korea National Health and Nutrition Examination Survey (KNHANES) and they also reported that prevalence of hypertension is higher in people aged 61 years or older than in other age groups. In agreement with these findings, the study results of this study also showed that the higher the age, the higher hypertension prevalence.
In relation to monthly household income, hypertension prevalence was found to be higher as income was decreased, and this finding is consistent with previous studies which reported that hypertension prevalence was increased as the economic level was lower [3, 6]. In this study, since the number of smokers was small, it was not possible to determine whether smoking was not a significant variable affecting hypertension prevalence. However, previous studies demonstrated that smoking is positively correlated with hypertension prevalence and it is a risk factor for cardiovascular disease, and systolic blood pressure was reported to be higher in smokers compared to non-smokers [12]. Regarding the level of alcohol consumption at a time, hypertension prevalence was found to be higher in people who have 5 or more drinks at a time than non-drinkers, and it was lower in people who have 1~2 drinks at a time, which can be regarded as a moderate level of alcohol consumption. This result is consistent with the previous studies which reported that the higher the rate of drinking, the higher hypertension prevalence [19], and that the appropriate amount of drinking is beneficial for health while excessive drinking has a harmful effect on health. With respect to the usual level of salt-intake, hypertension prevalence was found to be statistically significantly lower in those eating insipid foods and those eating normal foods compared to those eating very insipid foods. This result is not consistent with previous studies, and hypertension prevalence has been previously reported to decrease as the level of low-salt preference is higher [18]. In Korea, the majority of studies are cross-sectional studies, so it is difficult to find the results of prospective intervention studies on the blood pressure lowering effects of the decrease of salt intake. As for walking practice days a week, hypertension prevalence was lowered in people who practice walking 6 or more days a week compared to those who practice walking 2 days or less a week. These results suggest that hypertension prevalence could be lowered if exercises are performed almost every day. Considering these results, although there was no significant difference in the decrease of blood pressure in Song and Kim [9], it is predicted that continuous exercise will generally lead to a significant increase in physical activity and contribute to reduction of blood pressure and prevention of complications of hypertension. Both in Model 1, which included only individual-level factors, and in Model 2, which included both individual-level and regional-level factors, the relationships between the individual-level factors and hypertension were similar. This finding suggests that individual-level factors and regional-level factors are almost independently related to hypertension.
3. Regional-level Factors Affecting Hypertension Prevalence
As a result of constructing a multilevel model, 1.43% of hypertension was found to be caused by regional differences, and thus it was shown that hypertension prevalence could be changed not only by individual-level factors but also by regional-level factors. In an analysis of the factors of urban characteristics affecting the health of residents in urban communities, Lee [21] showed that 3.06% of hypertension was caused by regional differences. The regional differences in hypertension prevalence reported by Lee [21] were higher than 1.43% of this study, but it is a result of analyzing hypertension prevalence in 40 small and medium-sized cities. Since we studied hypertension prevalence in metropolitan cities, the results of this study is believed to reflect the regional characteristics of large cities. In addition, Lee [21] reported that the regional effect for EQ-5D (Euro Quality of life 5-Dimensions) in Seoul was about 3.6% when ‘dong (neighborhood)’ was used as the analysis unit, and Kim and Kang [5] reported that the regional effect for BMI (Body Mass Index) in municipalities (cities, counties, and districts) of the Seoul metropolitan area was estimated to be about 3.3%. Compared to the results, the regional variance ratio of this study was small [21]. The ICC value of 0.39% in this study indicates that about 0.39% of the difference in hypertension prevalence was due to the influence of the region which the subjects belong to. It is also a correlation coefficient among the members of the same region, so it can be said that hypertension prevalence in the residents of Seoul and 6 Metropolitan Cities has a correlation of about 0.39% with other residents in the same region. It is thought that the analysis unit of this study was too large to identify precise regional differences. Thus, if smaller areas (eup, myeon, and dong) are used as analysis units in a follow-up study, it will be possible to elucidate regional effects related to specific regional factors in a clearer manner. In addition, there are specific compositional factors attributable to the residents constituting each region [29], which is presumed to be the reason why there were not great regional differences in this study. As a result of the test for the multi-level model, hypertension prevalence was decreased as the number of doctors per 10,000 population was lower, and the number of health care institutions was found to be unrelated to hypertension prevalence. These results are not in agreement with the findings of previous studies. In some previous studies, the number of doctors and the number of medical institutions in the region have been pointed out as the indicators of the level of regional management of hypertension [20]. The results inconsistent with previous studies may indicate that although it is important to have the medical institutions close to the residential area and to secure sufficient medical manpower for early detection and continuous management of hypertension patients in urban areas, the role of doctors, who play a role in the domain of social support by protecting the health of individuals and encouraging health-promoting behaviors, has played a more decisive role than just the number of health care institutions and physicians. As for the number of parks, it was found that as the number of parks is smaller, hypertension prevalence is likely to be increased. This result is consistent with Kim and Kang's [5] finding that parks are a factor of urban environmental characteristics affecting the obesity rate of individuals, and it suggests that as the number of parks is smaller, the opportunities for physical activity is reduced, and this may affect hypertension prevalence. Regarding the relation between the number of bicycle roads and hypertension prevalence, the lower the number of bicycle roads, the lower hypertension prevalence, but the extension of bicycle roads showed a positive effect on hypertension prevalence. In this regard, further investigation is needed to determine whether the number of bicycle roads and the extension of bicycle roads are also factors related to hypertension prevalence by obtaining more detailed survey data and criteria on whether the access to bicycle roads is convenient in the residential area and whether there is a sufficient area of bicycle roads to get exercise effects rather than considering just the number and area of bicycle roads. It has been previously shown that hypertension prevalence has a statistically significant negative correlation with the percentage of obese people [5]. As to the number of fast food restaurants, hypertension prevalence was found to be 1.2 times higher in people living in a region with 100 or fewer fast food restaurants than in people living in a region with 200 fast food restaurants. In Kim and Kang [5], it was not a statistically significant factor, but the results of their study were in the opposite direction to the findings of this study. Therefore, in future studies, it will be necessary to conduct analysis in a more stringent manner by setting smaller regional units such as dong (neighborhood) by using disaggregated data or to investigate whether the influence of this factor may vary depending on the type and size of fast food restaurants.
In this study, health behavior factors of individuals and environmental factors of regions were identified as the factors related to hypertension prevalence, but specific analysis results on the direct and indirect relationships among the factors of each level were not presented. Because this study is a cross-sectional study using secondary data, it has the limitation that it cannot provide concrete causal relationships between the factors representing each level. In addition, it is thought that if panel data analysis is conducted by repeatedly investigating hypertension prevalence over several years in the same individuals considering their residence periods in the region, it will enable clearer interpretations of the effects of regional-level factors
Dahlgren and Whitehead's model of the social determinants of health, which was used as the conceptual framework of this study, is a model that emphasizes the influence of the environment of the community in determining the health status of individuals. It is an important attempt to examine hypertension prevalence at different levels by considering regional-level factors together with individual-level factors unlike previous studies confined to the analysis of individual-level factors. Although the influence of regional variables was small, it was confirmed that they influence the prevalence of hypertension independently from individual-level variables. In addition, it is a meaningful result that it was confirmed that the strategies for prevention and management of hypertension should be established by examining the spatial distribution of hypertension prevalence by si/gun/gu (city/county/district) and considering both individual-level factors and regional-level factors at the same time.
|
CONCLUSION
|
In this study, we conducted a multi-level analysis of individual-level factors and regional-level factors affecting hypertension prevalence in the residents of Seoul and 6 metropolitan cities in order to investigate the impact of multiple levels including the context of behaviors at the individual- level and sociopsychological, organizational, and environmental factors at the regional level based on Dahlgren and Whitehead's model of the social determinants of health. As a result, it was found that individual-level factors and regional level factors almost independently influence hypertension prevalence. Based on the results of this study, we present the following suggestions.
First, it is necessary to consider physical health determinants such as parks and bicycle roads for the management of hypertension when establishing plans related to healthy city projects. Second, the structural limitations of sample units inherent in the community health survey data (limitations on the acquisition of data on submunicipalities (eup/ myeon/dong), difficulty in obtaining other statistical data of municipalities (si, gun, and gu), and difficulty in the aggregation of community health survey data and statistics of municipalities should be dealt with by systematically constructing a database to help to establish urban environmental variables. Third, it is necessary to conduct research to analyze factors related to hypertension using small research units and actual measurement data through the combination of GIS technology for describing and visualizing the spatial distribution of spatial data and identifying irregular locations and spatial outliers with spatial regression analysis. Fourth, it is necessary to conduct a study which can reflect the hierarchical characteristics of data in a more concrete way by constructing a three level multilevel model considering individual, yearly, and regional factors. Finally, nurses in the local community need to take a health promotion approach to hypertension considering regional characteristics as well as individual characteristics by utilizing these study results.
|
Tables
|
|

|
Notes
|
This article is article is a revision of the first author's doctoral thesis from Inje University.
|
References
|
 PubReader
 Cite
Cite


