
Articles
- Page Path
- HOME > Res Community Public Health Nurs > Volume 35(1); 2024 > Article
-
Original Article
- Smartphone dependency latent profile classification and association with emotional and behavioral difficulties among high school students in Korea
-
Eunjoo Kim1
 , Min Kyung Song2
 -
Research in Community and Public Health Nursing 2024;35(1):84-98.
DOI: https://doi.org/10.12799/rcphn.2024.00465
Published online: March 29, 2024
1Assistant Professor, College of Nursing · Health and Nursing Research Institute, Jeju National University, Jeju, Korea
2Assistant Professor, Department of Nursing, College of Medicine, University of Ulsan, Ulsan, Korea
- Corresponding author: Min Kyung Song Department of Nursing, College of Medicine, University of Ulsan, 93, Daehak-ro, Nam-gu, Ulsan 44610, Korea Tel: +82-52-259-1570, Fax: +82-52-259-1236, E-mail: mk0408@ulsan.ac.kr
© 2024 Korean Academy of Community Health Nursing
This is an Open Access article distributed under the terms of the Creative Commons Attribution NoDerivs License. (http://creativecommons.org/licenses/by-nd/4.0) which allows readers to disseminate and reuse the article, as well as share and reuse the scientific material. It does not permit the creation of derivative works without specific permission.
- 642 Views
- 14 Download
Abstract
-
Purpose
- The pervasive integration of smartphones into adolescents’ daily lives has resulted in a concerning upsurge in smartphone dependency among high school students. Due to the diverse types and severity levels of smartphone dependency, there is a critical need for research to explore its heterogeneity. This study aimed to identify latent profile of smartphone dependency in high school students based on the four subdomains of smartphone dependency: disturbance of adaptive functions, virtual life orientation, withdrawal, and tolerance. In addition, we explored how emotional and behavioral difficulties differ according to the profiles.
-
Methods
- We used data from 2,195 Korean high school students from the Korean Children and Youth Panel Survey 2018. Latent profile analysis (LPA) was performed to identify smartphone dependency latent profile. Statistical analysis including chi-square test, Analysis of Variance (ANOVA), and ranked Analysis of Covariance (ANCOVA) confirmed differences in smartphone use characteristics and emotional-behavioral difficulties according to the classified latent profile.
-
Results
- LPA identified four distinct latent profiles of smartphone dependency among high school students; 1) Underdependent type, 2) Moderate type, 3) Habitual user type, and 4) Virtual space dependent type. The results of rank ANCOVA, controlling for gender, geographical location, economic status, parental smartphone dependency, and relational variables, revealed that habitual user type exhibited significantly higher rates of attention deficit hyperactivity disorder, social withdrawal, and depressive symptoms compared to other types.
-
Conclusion
- The identification of these profiles provides a foundation for developing tailored intervention programs for adolescents with different levels and patterns of smartphone dependency.
- 1. Background
- These days, for adolescents who have had easy access to digital devices and have been using them in their daily lives since childhood, the smartphone has become part of their lives and a primary means of social communication. According to the results of the ‘2022 Survey on Smartphone Overdependence’, the proportion of the risk group for smartphone overdependence among children and adolescents aged 10 to 19 was 40.1%. In this case, the risk group for smartphone overdependence includes the high-risk group and the potential risk group among smartphone users. The proportion of the risk group for smartphone overdependence was increased by approximately 10% in 2022, compared to 2019, indicating that the proportion and increase of the risk group for smartphone overdependence are the most serious levels in the 10-19 age group among all age groups [1]. This surge underscores the urgency of addressing smartphone overdependence.
- Smartphones are distinct from mobile phones in that they are mobile devices with expanded and advance features based on the use of the Internet. As a mobile device characterized by digital convergence, the smartphone enables not only the acquisition of information but also the immediate production of information through functions such as the simultaneous use of cameras, videos, and various applications, and these capabilities of smartphones can promote the use of social media [2]. In addition, smartphones provide users with more convenient access to desired programs, including the Internet, compared to PCs. They are conveniently portable at any time and are frequently used because information or messages are provided along with a notification sound for incoming messages [3]. The National Information Society Agency considered disturbance of adaptive functions, withdrawal, and tolerance as the common attributes of smartphone addiction and mobile phone addiction. Additionally, to reflect the characteristics of the smartphone itself, virtual life orientation was included as another attribute of smartphone addiction, resulting in the development of a standardized self-report smartphone addiction proneness scale for youth, consisting of four subdomains [3]. This scale is currently the most widely used tool in status surveys and studies on smartphone addiction in Korea. Disturbance of adaptive functions refers to a condition in which smartphone use becomes a very important part of a person’s daily life and dominates his or her thinking, emotions, and behaviors to such a degree that the smartphone user has difficulty living a normal life. Virtual life orientation means that a person much more prefers using a smartphone over spending time with the family or friends and places more value on online life than offline life. Withdrawal refers to the phenomenon of becoming anxious, nervous, and irritable when a person cannot use the smartphone, and tolerance refers to the phenomenon in which a person spends more and more time on smartphone use as he or she increasingly uses the smartphone [4]. This tool was developed in 2011 and named the standardized self-report smartphone addiction proneness scale for youth. However, due to the excessively negative connotations associated with the concept of ‘smartphone addiction’ and the criticism that it tends to consider the majority of smartphone users as potential addicts, ‘smartphone overdependence’ is increasingly being used instead of the term ‘smartphone addiction’ [4]. Nationwide panel surveys such as the Korean Children and Youth Panel Survey (KCYPS) also use this scale to measure smartphone overdependence. Therefore, this study also intended to use this scale to investigate smartphone overdependence.
- However, although the cut-off point of this scale allows us to classify the severity of smartphone overdependence, it has limitations in providing insight about the leverage point that can make changes in smartphone usage patterns for adolescents showing a high degree of smartphone overdependence. Therefore, in order to develop an intervention program for adolescents showing smartphone overdependence, there is a need to closely examine each domain or each attribute of smartphone overdependence. In the study by Bae [4], it was found that 60.8% of adolescents experienced disturbance of adaptive functions, due to smartphone overdependence, 44.6% showed virtual life orientation, 50.7% had the experience of withdrawal symptoms, and 68.3% had the experience of tolerance. In particular, the proportion of people experiencing difficulties due to tolerance was found to be significantly higher among adolescents than children or adults, suggesting that adolescents are unable to have control over their time due to smartphones and spend too much time on smartphone use. However, this previous study simply investigated the current status of smartphone overdependence among adolescents, and such research has limitations in identifying the patterns of each domain among individual adolescents showing smartphone overdependence.
- Latent profile analysis (LPA) is a person-centered statistical approach that focuses on analyzing similarities and differences between individuals rather than relationships between variables, and is a research method to identify unobserved subtypes or latent subgroups within a group [5,6]. These identified subgroups allow us to understand the characteristics of each group and examine distinctive associations between these characteristics and outcome variables. Considering that the concept of smartphone overdependence consists of four domains (disturbance of adaptive functions, virtual life orientation, withdrawal, and tolerance), there is a possibility that all adolescents do not show the same patterns for each domain. Therefore, by identifying subgroups with different patterns within the relevant population, we can understand differences among subgroups and develop more appropriate customized intervention strategies. In addition, if we identify differences in emotional and behavioral difficulties among the subgroups of smartphone overdependence of adolescents, it will allow us to develop customized interventions by taking into account the characteristics of each subgroup. Therefore, this study aimed to identify latent profiles of smartphone overdependence among high school students in Korea, based on responses regarding each domain of smartphone overdependence by using KCYPS data.
- Several studies have shown that smartphone dependency is closely associated with emotional and behavioral difficulties among adolescents, such as attention deficit hyperactivity disorder (ADHD) [7,8], aggression [9,10], social withdrawal [11,12], and depressive symptoms [13]. In general, previous studies assumed that all adolescents have the same characteristics rather than dividing them into subtypes of smartphone overdependence [7-13]. However, this study aimed to explore whether these emotional and behavioral difficulties differ according to classified latent profiles of smartphone dependency. In addition, this study also intended to examine whether there are differences in the domains reported to be associated with smartphone dependency such as gender [14,15], geographic location of the residence area [16,17], subjective household economic status [18,19], peer relationships [14,20,21], teacher relationships [20], parenting attitude [9,14,20], time spent with parents [22], and smartphone-use characteristics [14,15] according to the latent profiles of smartphone dependency. Through this, we aim to provide foundational data for development of smartphone overdependence prevention program and intervention programs for high-risk groups.
- 2. Objectives
- The specific objectives of this study are as follows:
- 1) To identify the latent profiles of smartphone dependency according to its attributes among high school students;
- 2) to investigate the differences in general characteristics and smartphone use characteristics of the participants according to the latent profiles of smartphone dependency among high school students;
- 3) to examine emotional and behavioral difficulties according to the latent profiles of smartphone dependency among high school students.
Introduction
- 1. Study design
- This study is a secondary data analysis research using data from the Korean Children and Youth Panel Survey 2018 (KCYPS 2018) to identify the latent profiles of smartphone dependency among high school students and investigate the emotional and behavioral difficulties according to the latent profiles.
- 2. Participants and data collection
- This study used data from the 4th Wave of the KCYPS 2018 (2021) conducted by the National Youth Policy Institute. The survey panel was established using a multistage stratified cluster sampling method, with adolescents who were in their first year of middle school in 2018 as the target population. The original panel consisted of 2,590 people, and follow-up surveys are conducted annually. The data of the original panel respondents and their guardians from the 4th Wave KCYPS 2018 conducted in 2021, which are the most recent data currently available, were used in the analysis of this study. The 4th Wave KCYPS 2018 was conducted in 2021, when the original panel of the middle school cohort became first-year high school students, and the retention rate of the original panel and the survey participation rate of the guardians of the original panel were 87.5% and 87.2%, respectively.
- In this study, the variables pertaining to the father or mother as the primary caregiver (e.g., the primary caregiver’s smartphone dependency) were included as independent variables. Data from both students and guardians were merged for analysis purposes. The main variable in this study was smartphone dependency, and respondents with missing data for the questions on smartphone dependency were excluded (n=21). In addition, when the survey respondent was not the primary caregiver, the participant was excluded from the study (n=49). The samples provided were 2,265 people, and 2,195 people were included in the final analysis.
- 3. Measures
- In KCYPS 2018, smartphone dependency was investigated using the 15-item scale constructed based on the self-report smartphone addiction proneness scale developed by Kim et al. [2]. This 15-item scale includes 5 items about disturbance of adaptive functions, 2 items about virtual life orientation, 4 items about withdrawal, and 4 items about tolerance. Each item was rated on a 4-point Likert scale ranging from 1 point (=‘Not at all’) to 4 points (=‘Very much’). Higher total scores indicate higher levels of smartphone dependence of adolescents. Based on the total score and the scores of the three subdomains (disturbance of adaptive functions, withdrawal, and tolerance), the respondents are classified into three groups: the ‘high-risk user group’, ‘potential risk user group’, and ‘normal user group’ [3]. According to this scale [3], people with a total score of 45 points or more based on a standardized score of 70 points, or those with 16 points or more in disturbance of adaptive functions, 13 points or more in withdrawal, and 14 points or more in tolerance are categorized as the high-risk user group. People who meet one of the following four conditions are categorized as the potential risk user group: 1) a total score of 42 to 44 points; 2) 14 points or more in disturbance of adaptive functions; 3) 12 points or more in withdrawal; or 4) 13 points or more in tolerance. Lastly, the normal user group are people who meet the following conditions: 1) a total score of 41 points or less; 2) 13 points or less in disturbance of adaptive functions; 3) 11 points or less in withdrawal; and 4) 12 points or less in tolerance. To identify the latent subgroups based on smartphone dependency, this study used the mean values of each of the following four subdomains: disturbance of adaptive functions, virtual life orientation, withdrawal, and tolerance. The value of Cronbach’s ⍺ was .81 in the study by Kim et al. [2] and it was .86 in this study.
- In KCYPS 2018, a modified version of the self-report emotional or behavioral problems scale for children developed by Cho & Lim [23] was used to assess attention deficit hyperactivity disorder (ADHD) and aggression. The scale contains 7 items about ADHD and 6 items about aggression. Each item was rated on a 4-point Likert scale ranging from 1 point (=‘Not at all’) to 4 points (=‘Very much’). The level of each variable was analyzed using the total score of the items in each subdomain, and higher total scores indicates higher levels of ADHD and aggression. The values of Cronbach’s ⍺ for ADHD and aggression were .78 and .76, respectively, in the study by Cho and Lim [23], and they were .84 and .85, respectively in this study.
- In KCYPS 2018, social withdrawal was measured by a modified and supplemented version of a behavior problem scale for children and adolescents developed by Kim and Kim [24]. The scale consists of a total of 5 items rated on a 4-point Likert scale ranging from 1 point (=‘Not at all’) to 4 points (=‘Very much’), and a higher total score indicates a higher level of social withdrawal. The value of Cronbach’s ⍺ was reported as .79 in the study by Kim and Kim [24], and it was .88 in this study.
- In KCYPS 2018, depressive symptoms were measured by a modified 10-item version of the 13-item depression scale from a short-form mental health symptom checklist presented by Kim et al. [25]. Each item was rated on a 4-point Likert scale ranging from 1 point (=‘Not at all’) to 4 points (=‘Very much’), and higher total scores indicate more depressive symptoms. The value of Cronbach’s ⍺ was reported as .86 in the study by Yeom et al. [26], and it was .90 in this study.
- General characteristics examined in this study are as follows: gender, geographical location, subjective household economic status, relationship with peers, relationship with teachers, parenting attitude, and time spent with parents. Smartphone use characteristics analyzed in this study are the frequency of smartphone use by purpose, average daily time spent using smartphones during leisure time, and parental smartphone dependency.
- In the KCYPS 2018, the geographical location of the residence area was divided into metropolis, urban (small and medium-sized cities), and rural (eup/myeon) areas. The subjective household economic status was classified based on the guardian’s response on a 5-point Likert scale, ranging from the highest to the lowest, which was condensed into three categories: good (very good, good), fair, poor (poor, very poor).
- For relationship with peers, in the KCYPS 2018, it was measured using the peer relationship quality scale for adolescents developed by Bae et al. [27]. This scale contains 8 items about positive relationships and 5 items about negative relationships. Each item was rated on a 4-point Likert scale ranging from 1 point (=‘Not at all’) to 4 points (=‘Very much’). The total score for positive relationships and the total score for negative relationships are calculated, respectively, and higher total scores indicate stronger perceptions of positive or negative peer relationships. In the study by Lee [28], the value of Cronbach’s ⍺ was reported as .87 for positive relationship with peers and .80 for negative relationship with peers. In this study, the value of Cronbach’s ⍺ was .86 for positive relationship with peers and .85 for negative relationship with peers.
- In the KCYPS 2018, relationship with teachers was measured using the 14-item student-teacher attachment relationship scale developed by Kim and Kim [29]. Each item was assessed on a 4-point Likert scale ranging from 1 point (=‘Not at all’) to 4 points (=‘Very much’), and a higher total score indicates the student’s more positive perception of the relationship with teachers. The value of Cronbach’s ⍺ was .88 in Kim et al. [29], and it was .91 in this study.
- For parenting attitude, in the KCYPS 2018, it was measured using the 24-item parenting attitude scale for adolescents validated by Kim and Lee [30]. It consists of 12 items on positive parenting attitudes and 12 items on negative parenting attitudes. Each item was assessed on a 4-point Likert scale ranging from 1 point (=‘Not at all’) to 4 points (=‘Very much’). The total scores for positive and negative parenting attitudes are calculated respectively, and higher total scores indicate higher levels of positive and negative parenting attitudes. The value of Cronbach’s ⍺ ranged from .75 to .88 in the study by Kim and Lee [30], and the value of Cronbach’s ⍺ was .92 for positive parenting attitudes, and .87 for negative parenting attitudes in the study by Kim and Ahn [31]. In this study, the value of Cronbach’s ⍺ was .91 for positive parenting attitudes, and .88 for negative parenting attitudes. In KCYPS 2018, time spent with parents was divided into weekdays and weekends, and the average hours and minutes spent with parents per day were examined. In this study, average time spent with parents per week was calculated by adding ‘average time spent with parents per day during weekdays’ × 5 days and ‘average time spent with parents per day during a weekend’ × 2 days.
- As for smartphone usage type, in the KCYPS 2018, this variable was examined using a modified and supplemented version of the 2013 youth media use survey questionnaire developed by Bai et al. [32]. Smartphone usage type was divided into 13 categories: calls with the family, messaging with the family, calls with friends, messaging with friends, social networking services (SNS), playing games, taking photos/videos, watching TV and videos, listening to music, information search, viewing documents, learning or work, and others. Each item was rated on a 4-point Likert scale ranging from 1 point (=‘Never use it’) to 4 points (=‘Frequently use it.’). In this study, smartphone usage type was reclassified into 8 categories by grouping together some categories into a single category as follows: ‘calls with family’, ‘messaging with family’, ‘calls with friends’, and ‘messaging with friends’ were grouped together as ‘calls/messaging’, ‘watching TV and videos’ and ‘listening to music’ were grouped together as ‘multimedia use’, and ‘viewing documents’ and ‘others’ were also grouped together as ‘others.’ In the case of reclassified items, the mean score of the items grouped together was used, and a higher score indicates the more frequent use of the smartphone for that purpose.
- Regarding the duration of daily smartphone use, in KCYPS 2018, average daily time spent using smartphones during leisure time was divided into the duration of smartphone use on weekdays and on weekends. It was classified into ‘Never use it’, ‘Less than 30 minutes’, ’30 minutes to less than 1 hour’, ‘1 hour to less than 2 hours’, ‘2 hours to less than 3 hours’, and ‘3 hours to less than 4 hours’, and ‘more than 4 hours.’ In this connection, according to the ‘2021 National Leisure Activity Survey’, adolescents’ average leisure time using smart devices was found to be 2.6 hours on weekdays and 3.4 hours on weekends [33]. In this study, based on the results of the ‘2021 National Leisure Activity Survey’, average daily time spent using smartphones during leisure time was divided into ‘less than 1 hour’, ‘1 hour to less than 3 hours’, and ‘3 hours or more.’
- As for parental smartphone dependency, in the KCYPS 2018, it was examined using the 15-item scale constructed based on the self-report smartphone addiction proneness scale developed by Kim et al. [2]. The scale contains 5 items on disturbance of adaptive functions, 2 items on virtual life orientation, 4 items on withdrawal, and 4 items on tolerance. Each item was rated on a 4-point scale ranging from ‘Not at all (1 point)’ to ‘Very much (4 points),’ and a higher total score indicates the primary caregiver’ greater degree of smartphone dependency. Cronbach’s ⍺ was .81 in the study by Kim et al. [2], and it was .84 in this study.
- 4. Data collection and analysis
- In order to identify the latent profiles according to the subdomains of smartphone dependency among high school students, the four indicators were selected: disturbance of adaptive functions, virtual life orientation, tolerance, and withdrawal. In the LPA, model estimation is performed by increasing the number of latent groups, and through the processes of model fit analysis and comparison of models, the number of latent groups is finally determined based on the best-fit model. When determining the number of latent groups, information criterion indices such as the sample-size adjusted BIC (saBIC) and the Bayesian information criterion (BIC), the results of the likelihood ratio test method using the Lo-Mendell-Rubin likelihood ratio test (LMR) and the bootstrap likelihood ratio test (BLRT), and entropy values are checked, and the distribution rate for each latent profile is also comprehensively considered [34]. For the information criterion indices, a better model shows a smaller value, and in the likelihood ratio tests, if the likelihood ratio is <.05, it means that the k latent group model is better than the k-1 group model in terms of model fit [34,35]. For entropy values, a value closer to 1 indicates a higher level of classification accuracy [36].
- Descriptive statistics, chi-square test, and Analysis of Variance (ANOVA) were used to compare the general characteristics and smartphone use characteristics of the participants between the identified latent profiles of smartphone dependency, and a post-hoc test was performed using the Sheffé test. In order to examine differences in emotional and behavioral difficulties between the latent profiles of smartphone dependency among high school students, ranked Analysis of Covariance (ANCOVA) was conducted after controlling for general characteristics, parental smartphone dependency, and relational variables, which showed a statistically significant relationship with each latent profile. A post-hoc test was performed using the Tukey-Kramer test, and the statistical significance level was adjusted to .0083 using the Bonferroni correction to control the overall probability of the type 1 error [37]. Statistical analysis was performed using Mplus 8.0 (Muthen & Muthen, Los Angeles, CA, USA) and SPSS 29.0 (IBM Corp., Armonk, NY, USA).
- 5. Ethical considerations
- This study was conducted after receiving an exempt determination from the institutional review board of Jeju National University (IRB No. JJNU-IRB-2023-052). The data of the Korean Children and Youth Panel Survey (KCYPS) is publicly available through the KCYPS data archive (https://www.nypi.re.kr/archive/contents/siteMain.do), and individuals can obtain the data by submitting a data use agreement form. The KCYPS 2018 data provided to researchers does not contain any personally identifiable information and has been anonymized.
Methods
1) Smartphone dependency
2) Emotional and behavioral difficulties
3) General characteristics and smartphone use characteristics of the participants
- In this study, latent profile analysis was performed to determine the number of latent subgroups according to the subdomains of smartphone dependency (disturbance of adaptive functions, virtual life orientation, withdrawal, and tolerance) among high school students. To determine the best-fit model, this study examined the model fits by increasing the number of latent profiles from two-profile model to five-profile model (Table 1). BIC and saBIC values were decreased as the number of classes increased, and these indices were lowest in the 5-profile model. An entropy value [36] closer to 1 indicates a higher level of classification accuracy, and the entropy value was highest in the 4-profile model. LMR and BLRT values were found to be statistically significant in 2-, 3-, and 4-profile models (p<.001), confirming the existence of distinct heterogeneous groups in terms of smartphone dependency. LMR was not statistically significant in the 5-profile model.
- The 4-profile model had lower BIC and saBIC values than 2- and 3-profile models, and LMR and BLRT indicated that both models supported the alternative hypothesis (p<.001). The 4-profile model was found to have more information than the 3-profile model, and the distribution rate ranged from 11.8% to 47.0%, indicating a high level of practicality. The 4-profile model was selected because it had low model fit indices, its entropy value was closest to 1, more than 5.0% of the total samples were present in all groups, and sufficiently meaningful and distinct characteristics for each group were found. The average posterior probability value of the finally determined 4-profile model was close to 1, ranging from .79 to .90, which indicated a high level of classification accuracy.
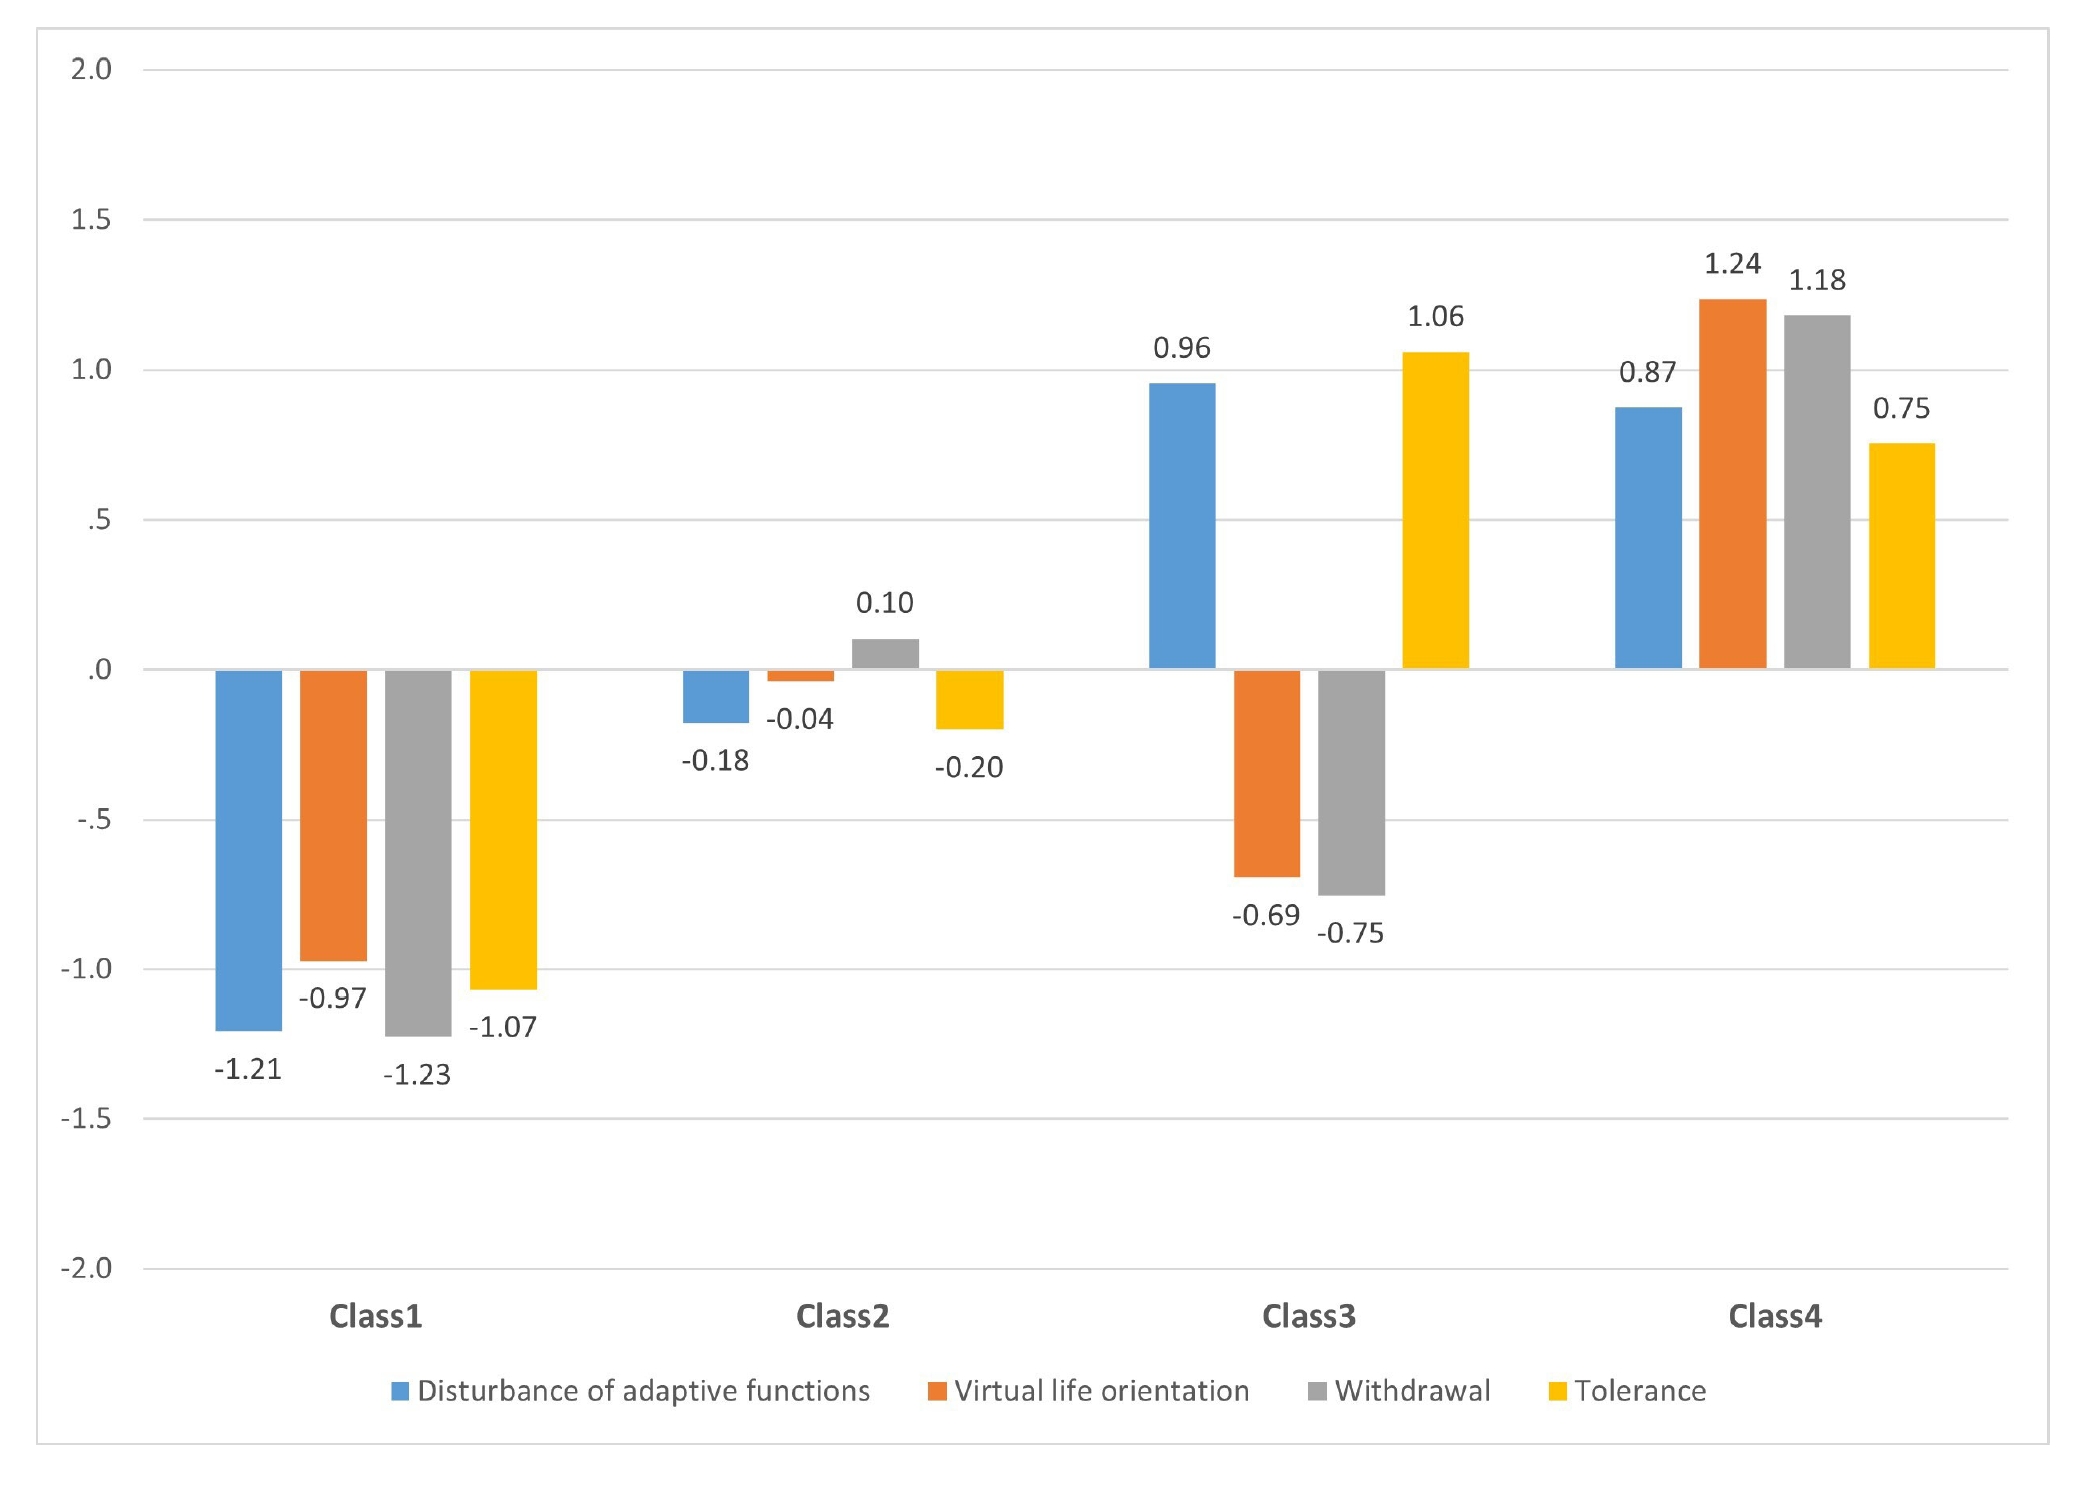
- 1. Latent profiles of smartphone dependency among high school students
- The results of identifying the latent classes of smartphone dependency among high school students are shown in Figure 1 and Table 2. Class 1 (n=410, 18.7%) has low scores in all the four domains of disturbance of adaptive functions, virtual life orientation, withdrawal, and tolerance. This group showing a low level of smartphone dependence and healthy usage patterns, and the group was named the ‘underdependent type.’ Class 2 (n=1,033, 47.0%) is a group showing a medium level of smartphone dependency in all four domains and was referred to as ‘the moderate type’. Class 3 (n=259, 11.8%) is characterized by high levels of disturbance of adaptive functions and tolerance but a low level of virtual life orientation. This group shows a significant negative impact of excessive smartphone use on daily life, including activities at home and at school, and this group needs increasingly more stimulations for the same degree of satisfaction. In consideration of these characteristics, Class 3 was named the ‘habitual user type.’ Class 4 (n=493, 22.5%) is characterized by high levels of virtual life orientation and withdrawal and was termed as the ‘virtual space dependent type.’
- 2. General characteristics and smartphone use characteristics of the participants according to the latent profiles of smartphone dependency
- The general characteristics and smartphone use characteristics of the high school students included in this study are shown in Table 3. The gender proportion difference among the latent classes of smartphone dependency was statistically significant, and the proportion of female students was higher in the habitual user type and virtual space dependent type (χ2=10.34, p=.016). Also, the proportion of people living in urban areas (χ2=22.75, p=.001) and the proportion of people who rated subjective household economic status as poor (χ2=33.20, p<.001) were also higher in the habitual user type and virtual space dependent type.
- Regarding the differences in relationships with peers, teachers, and parents according to latent profiles, the score for positive relationship with peers was higher in the underdependent type and the habitual user type than other types (F=21.36, p<.001), and the virtual space dependent type showed a higher score for negative relationship with peers than other types (F=85.14, p<.001). The score for relationship with teachers was highest in the underdependent type and lowest in the virtual space dependent type (F=33.37, p<.001). For positive parenting attitude, the underdependent type had the highest score (F=63.24, p<.001), and for negative parenting attitude, the virtual space dependent type had the highest score (F=124.49, p<.001). As for time spent with parents, the underdependent type and habitual user type spent more time with their parents than the other types, while the virtual space dependent type spent the least time with their parents (F=22.13, p <.001).
- As a result of examining differences in the smartphone usage type among latent profiles, the frequency of using the smartphone for multimedia use was higher in the habitual user type than in other types (F=10.07, p<.001), and the frequency of using the smartphone for SNS was statistically significantly higher in the habitual user type and virtual space dependent type, compared to the underdependent and moderate types (F=11.05, p<.001). In addition, compared to other types, the virtual space dependent type showed higher rates of smartphone use for playing games (F=24.60, p<.001), taking photos or videos (F=22.54, p<.001), learning (F=6.09, p<.001), and others (F=11.25, p<.001). Regarding average daily time spent using smartphones during leisure time, the proportion of adolescents spending more than 3 hours a day on smartphones was highest in the habitual user type with 30.5% for weekdays and 68.0% for weekends.
- With respect to smartphone dependency among high school students, the virtual space dependent type showed the highest score for smartphone dependency (40.91±3.43 points), and also showed the highest proportion of the high-risk user group for smartphone overdependence at 15.0%. The habitual user type had the second highest score for smartphone dependence at 35.42±3.98 points. In the habitual user type, the proportion of the potential risk user group was a high level of 70.7%, but the proportion of the high-risk user group was 1.9%. 99.3% of adolescents in the underdependent type were categorized as the normal user group according to the criteria of the smartphone overdependence proneness scale, and only 0.7% belonged to the potential risk user group. For the moderate type, 9.1% of this group belonged to the potential risk user group. There were no high-risk user group in the underdependent type and moderate type. For parental smartphone dependency, the virtual space dependent type showed the highest score (31.58±6.01points) (F=73.33, p <.001).
- 3. Emotional and behavioral difficulties according to latent profiles of smartphone dependency
- The results of descriptive statistical analysis of emotional and behavioral difficulties showed that the levels of ADHD, aggression, and depressive symptoms were highest in the virtual space dependent type, and the level of social withdrawal was highest in the habitual user type. After controlling for gender, geographic location, economic status, parental smartphone dependency, and relational variables, the ranked ANCOVA results showed that there were significant differences in ADHD (F=49.70, p<.001), aggression (F=17.29, p<.001), social withdrawal (F=34.01, p<.001), and depressive symptoms (F=38.24, p<.001) according to the latent profiles of smartphone dependency among high school students (Table 4). The underdependent type had the lowest scores for all the four categories of emotional and behavioral difficulties, and the habitual user type showed the highest scores for all the four categories. The level of aggression was the high in both the habitual user type and the virtual space dependent type. As for ADHD and depressive symptoms, the habitual user type had the highest scores, followed by the virtual space dependent type, moderate type, and underdependent type in descending order.
Results
- This study was conducted using data from the 4th Wave KCYPS 2018 to classify the latent profiles of smartphone dependency according to the subdomains of smartphone dependency among high school students and to identify differences in general characteristics, smartphone use characteristics and emotional and behavioral difficulties according to the latent profiles.
- The classification of latent profiles according to the subdomains of high school smartphone dependency revealed four latent profiles. The underdependent type showed low levels of all four subdomains, and the moderate type showed medium levels of all four subdomains. The habitual user type showed high levels of disturbance of adaptive functions and tolerance but a low level of virtual life orientation. Lastly, the virtual space dependent type exhibited particularly high levels of virtual life orientation and withdrawal, compared to other types. Some cases of the habitual use type or virtual space dependent type in this study were classified as the general user group according to the criteria of the smartphone overdependence scale. This is due to the fact that in terms of the criteria of the scale, the domain of virtual life orientation is not included in the specific criteria for classification but is included only in the criteria of the total score [3]. According to the classification criteria of the scale, the criteria for the high-risk user group are somewhat strict because the high-risk user group only includes cases that satisfy both the total score criterion and the cut-off point for each domain. On the other hand, the potential risk user group encompasses a broader range because this group is regarded as a union of the group satisfying the total score criterion and groups satisfying the cut-off point for each domain.
- Considering the relationship between each latent profile and emotional and behavioral difficulties shown in the results of this study, even when individuals are categorized as the general user group according to the criteria of the smartphone overdependence scale, it is necessary to closely examine whether they are categorized as the habitual user type or the virtual space dependent type in terms of detailed aspects of smartphone dependency. The scores for ADHD, aggression, and depressive symptoms were highest in the virtual space dependent type, followed by the habitual user type. For social withdrawal, the habitual user type had the highest score for this domain and the virtual space dependent type had the second highest score. In agreement with the findings of previous studies, the results of this study also showed that adolescents exhibiting a high level of smartphone dependency, such as the habitual user type or the virtual space dependent type, showed high levels of ADHD [7,8], aggression [9,10], social withdrawal [11,12], and depressive symptoms [13]. However, considering that the proportion of the general user group is about 30% in both types, the results of this study suggest that when screening adolescents for smartphone dependency, simply considering the severity of smartphone dependency based on the criteria of the smartphone overdependence scale may have some problems. In other words, this means that among the general user group, some smartphone users who can prevent the transition to smartphone overdependence may be overlooked. In this study, compared to other types, the habitual use type and virtual space dependent type showed relatively higher proportions of female adolescents, adolescents living in urban areas, and those with poor subjective household economic status, and these results are consistent with the findings of previous studies [15,17,19]. However, since this study investigated differences in general characteristics according to latent profiles only using descriptive statistics, further research is needed to investigate how these differences in general characteristics affect the distinct latent profiles.
- With respect to smartphone use characteristics, in terms of average daily time spent using smartphones during leisure time on weekdays, the proportion of less than 1 hour was significantly lower in the habitual user type compared to other types. In particular, the proportion of adolescents spending more than 3 hours on smartphone use on weekends was 68.0% in the habitual user type, and this percentage is more than two times higher than in the underdependent type (32.0%) or the moderate type (30.0%) and it is about 1.5 times higher than in the virtual space-dependent type (45.0%). In terms of the types of smartphone usage, the habitual user type had a higher score for the use of multimedia such as TV, video, and music than other types. The habitual user type and virtual space dependent type showed higher scores for SNS than the underdependent and moderate types. In particular, the virtual space dependent type was found to use smartphones more for other types of smartphone usage, including games, compared to other latent profiles. In this study, it is difficult to accurately examine the total duration of daily smartphone use because the KCYPS 2018 only investigated average daily time spent using smartphones during leisure time, not the total duration of daily smartphone usage. However, since there was no statistically significant difference in the use of the smartphone for calls/messaging or information search according to the latent profiles, differences in usage pattern between latent profiles are thought to be primarily influenced by differences in smartphone use during leisure activities. According to a previous research [38], the use of smartphones for information seeking, SNS, and games was found to have a positive impact on smartphone overdependence among adolescents. In particular, games are highly likely to cause smartphone overdependence because they provide vicarious satisfaction or rewards of immediate pleasure [39]. Furthermore, nowadays among adolescents, capturing photos or videos not only serves the purpose of personal possession but also significantly involves utilizing SNS to share them in virtual spaces and engage in communication within them [40,41]. Moreover, such behaviors are closely associated with their identity formation as well [42]. The types of smartphone usage among adolescents are interconnected rather than fragmented, so intervening with smartphone-dependent adolescents should prioritize understanding the underlying motivations that reinforce smartphone usage. Therefore, it is important to simultaneously emphasize awareness of smartphone use and cultivation of healthy usage habits so that adolescents can self-regulate their smartphone use patterns. In addition, efforts are needed to promote physical activities and encourage participation in art and cultural events, and expand infrastructure for adolescents’ leisure activities to support these endeavors so that their leisure activities are not limited to sedentary activities using smartphones.
- An interesting finding is that descriptive statistical analysis showed that the scores for all the domains of emotional and behavioral difficulties were highest in the virtual space dependent type, but when ranked ANCOVA was performed after controlling for covariates (gender, geographic location, subjective economic status, parental smartphone dependency, and relationship variables), the results of ranked ANCOVA showed that the levels of ADHD, social withdrawal, and depressive symptoms were statistically significantly higher in the habitual user type than in the virtual space dependent type. In the additional analysis, covariates were entered in a stepwise manner, and the above results were obtained when relational variables were entered. In this study, the habitual user type showed a better level of relational variables, compared to the virtual space dependent type. The virtual space dependent type had a higher score for negative relationship with peers than other types, but the habitual user type showed a high level of positive relationship with peers, which was a similar level to that of the underdependent type. In addition, the virtual space dependent type had a high score for the negative parenting attitude, and was found to spend the least time with their parents, while the habitual user type had the highest score for time spent with parents, which was a similar level to that of the underdependent type. These results are presumed to show that since adolescents in the habitual user type have positive relationships with people around them, and these relational factors are performing the role of partially buffering emotional and behavioral difficulties [43-45]. In addition, adolescents with relatively negative perceptions in terms of relationships with people around them were highly likely to belong to the virtual space dependent type and experienced more emotional and behavioral difficulties. However, this study had limitations in determining whether these adolescents’ dissatisfaction with real-life relationships led to their increased dependence on virtual space [46,47], or whether their high dependence on virtual space had a negative impact on relationships in real life [48,49]. Further research is needed to investigate the causal relationship. Therefore, intervention programs designed to reduce emotional and behavioral difficulties resulting from smartphone dependence should take into account the complex interactions of relationships with parents and peers, and should focus on improving these relationships and addressing adolescents’ psychological needs.
- In addition, there is a need to vary intervention approach depending on the latent profiles identified in this study. First, in the case of the habitual user type, it is necessary to provide an intervention to reduce daily smartphone usage time itself. For the habitual user type, this method may be effective because this group does not show withdrawal symptoms even if they stop using smartphones temporarily. For example, it is necessary to provide an intervention to block unconscious smartphone uses due to SNS algorithms and the infinite scroll function and to break a chain of habits, and such interventions may utilize digital detox training, such as providing feedback to check one’s smartphone usage patterns, utilizing apps that limit smartphone usage time, turning off app notification settings, and deleting non-essential apps if possible, and using a smartphone timer box with a lock [50,51]. In addition, to utilize the positive relationships with peers and parents shown by the habitual user type, peers and parents can be actively utilized as part of an intervention program [52,53]. On the other hand, in the case of the virtual space dependent type, this group has high levels of virtual life orientation and withdrawal, so an attempt to drastically restrict their smartphone use may result in increased symptoms of emotional and behavioral difficulties [54]. Therefore, rather than suddenly restricting their smartphone use, it is necessary to provide training to gradually develop their control over smartphone use in conjunction with expert counseling.
- The results of this study showed that 1 out of 10 adolescents belongs to the habitual user type and 1 out of 5 adolescents belongs to the virtual space dependent type. When combining the habitual use type and the virtual space dependence type among all adolescents, they account for a significant proportion of approximately one third. This means that adolescents at high-risk of mental health problems associated with smartphone overdependence account for a considerable proportion of the adolescent population. Therefore, these subgroups should be emphasized as groups that deserve more attention in terms of the mental health of adolescents. In addition, when determining the scale of an intervention program in the field of nursing practice, the distributions of the habitual use type and virtual space dependent type in the total population of adolescents can be used as reference data. The proportion of each latent profile can be used as an important indicator in determining the target population of an intervention program and adjusting the scale and resource allocation of the intervention program.
- This study has some limitations. First, this study is a secondary data analysis and used the limited variables included in the panel data. In particular, in the case of the variable of average daily time spent on smartphones, it was measured using a question about average daily time spent using smartphones during leisure time, so it was not possible to examine the total duration of daily smartphone usage. Also, since the responses about the type of smartphone usage were also categorical, there were limitations on the investigation of smartphone usage types. Second, because this study was a cross-sectional study using the most recent data of the KCYPS 2018, only first-year high school students were included as the participants in the study. Thus, further research is needed to examine whether the latent profiles are classified into similar types in other age groups of adolescents.
Discussion
- This study used data from the Korean Children and Youth Panel Survey (KCYPS) conducted in 2021 to identify the latent profiles of smartphone dependency among first-year high school students in Korea. The latent profiles of smartphone dependency were classified based on four domains: disturbance of adaptive functions, virtual life orientation, withdrawal, and tolerance. As a result, four latent profiles were identified. The ‘underdependent type’ showed low levels of all the four domains, and the ‘moderate type’ showed medium levels of all the four domains. The ‘habitual user type’ showed high levels of disturbance of adaptive functions and tolerance, and the ‘virtual space dependent type’ showed high levels of all domains but especially high levels of virtual life orientation and withdrawal. Since the identified four latent profiles of smartphone dependency respectively represents groups with different characteristics of smartphone dependency, various intervention strategies for each latent profile are needed based on the results of this study.
- The comparison of emotional and behavioral difficulties between the latent profiles showed that the levels of attention deficit hyperactivity disorder, aggression, social withdrawal, and depressive symptoms were highest in the virtual space dependent type. However, the results of ranked ANCOVA performed after controlling for covariates revealed that the habitual user type with positive relationships with parents and peers showed statistically significantly higher levels of attention deficit hyperactivity disorder, social withdrawal, and depressive symptoms, compared to the virtual space dependent type. Considering that the habitual user type was found to have positive relationships with parents and peers, the results suggest that the relational variables may play the role of buffering the impact of smartphone dependency on emotional and behavioral difficulties. Therefore, it is necessary to consider relational aspects in intervention strategies for smartphone dependency among adolescents. These research results can be used as basic data for early detection of emotional and behavioral difficulties related to smartphone overdependence among adolescents and provision of appropriate support in the field of nursing practice in school.
Conclusions
-
Conflict of interest
The authors declared no conflict of interest.
-
Funding
This work was supported by the research grant of College of Nursing, Jeju National University Fund in 2023.
-
Authors’ contributions
Eunjoo Kim contributed to conceptualization, funding acquisition, project administration, writing – original draft, review & editing, resources, supervision, and validation. Min Kyung Song contributed to data curation, formal analysis, methodology, visualization, writing – original draft, review & editing, and software.
-
Data availability
Please contact the corresponding author for data availability.
NOTES
Acknowledgments
Illustration of z-score distribution of smartphone dependency in the four profiles defined in the latent profile analysis
- 1. National Information Society Agency. The survey on smartphone overdependence. Daegu: Ministry of Science and ICT, 2022. Report No.: NIA Ⅷ-RSE-C-22052.
- 2. Kim DI, Chung YJ, Lee JY, Kim MC, Lee YH, Kang EB, et al. Development of smartphone addiction proneness scale for adults: Self-report. Korea Journal of Counseling. 2012;13(2):629–644. https://doi.org/10.15703/kjc.13.2.201204.629Article
- 3. Shin KW, Kim DI, Jeong Y, Lee J, Lee Y, Kim M, et al. Development of Korean smartphone addiction proneness scale for youth and adults. Seoul: Korean National Information Society Agency, 2011. Report No.: NIA Ⅳ-RER-11051.
- 4. Bae Y. The Reality and Issues of Smartphone Overdependence [Internet]. Daejeon: Statistics Research Institute; 2016 [cited 2023 May 13]. Available from: https://kostat.go.kr/board.es?mid=a90104010301&bid=12309&tag=&act=view&list_no=370220&ref_bid=
- 5. Berlin KS, Williams NA, Parra GR. An introduction to latent variable mixture modeling (part 1): Overview and cross-sectional latent class and latent profile analyses. Journal of Pediatric Psychology. 2014;39(2):174–187. https://doi.org/10.1093/jpepsy/jst084ArticlePubMed
- 6. Mathew A, Doorenbos AZ. Latent profile analysis – An emerging advanced statistical approach to subgroup identification. Indian Journal of Continuing Nursing Education. 2022;23(2):127–133. https://doi.org/10.4103/ijcn.ijcn_24_22Article
- 7. Kocyigit S, Guzel HS, Acikel B, Cetinkaya M. Comparison of smartphone addiction level, temperament and character and parental attitudes of adolescents with and without attention deficit hyperactivity disorder. International Journal of Mental Health and Addiction. 2021;19:1372–1384. https://doi.org/10.1007/s11469-021-00494-2Article
- 8. Kwon SJ, Kim YJ, Kwak YH. Influence of smartphone addiction and poor sleep quality on attention-deficit hyperactivity disorder symptoms in university students: A cross-sectional study. Journal of American College Health. 2022;70(1):209–215. https://doi.org/10.1080/07448481.2020.1740228ArticlePubMed
- 9. Doo EY, Kim JH. Parental smartphone addiction and adolescent smartphone addiction by negative parenting attitude and adolescent aggression: A cross-sectional study. Frontiers in Public Health. 2022;10:981245. https://doi.org/10.3389/fpubh.2022.981245ArticlePubMedPMC
- 10. Kim MO, Kim HJ, Kim KS, Ju SJ, Choi JH, Yu M. Smartphone addiction: (Focused depression, aggression and impulsion) among college students. Indian Journal of Science and Technology. 2015;8(25):1–8. https://doi.org/10.17485/IJST/2015/V8I25/80215Article
- 11. Lim SA. Longitudinal effect of social withdrawal on negative peer relations mediated by smartphone dependence among Korean early adolescents. International Journal of Mental Health and Addiction. 2023;21(5):3061–3075. https://doi.org/10.1007/s11469-022-00774-5Article
- 12. Park JH, Choi JM. Smartphone overdependence and quality of life in college students: Focusing on the mediating effect of social withdrawal. Frontiers in Public Health. 2022;10:997682. https://doi.org/10.3389/fpubh.2022.997682ArticlePubMedPMC
- 13. Elhai JD, Dvorak RD, Levine JC, Hall BJ. Problematic smartphone use: A conceptual overview and systematic review of relations with anxiety and depression psychopathology. Journal of Affective Disorders. 2017;207(1):251–259. https://doi.org/10.1016/j.jad.2016.08.030ArticlePubMed
- 14. Kim EJ, Jo JH, Song MK. Latent classes of smartphone dependency trajectories and predictors of classes among middle school students in South Korea. Journal of Pediatric Nursing. 2023;73:44–52. https://doi.org/10.1016/j.pedn.2023.08.013ArticlePubMed
- 15. Lee EJ, Kim YK, Lim SJ. Factors influencing smartphone addiction in adolescents. Child Health Nursing Research. 2017;23(4):525–533. https://doi.org/10.4094/chnr.2017.23.4.525Article
- 16. Daoud O, Abdo JB, Demerjian J. Implications of smartphone addiction on university students in urban, suburban and rural areas. International Journal of Education Economics and Development. 2021;12(1):17–26. https://doi.org/10.1504/ijeed.2021.10033131Article
- 17. Kim JO. Factors and health behaviors affecting smartphone over-dependency among adolescents: Focus on 2020 adolescents’ health behavior survey. The Korean Society of Health Service Management. 2021;15(2):91–105. https://doi.org/10.12811/kshsm.2021.15.2.091Article
- 18. Lee EJ. Comparison of factors related to smartphone dependency among middle school, high school, and college students based on the seventh Korean children and youth panel survey. Child Health Nursing Research. 2019;25(2):165–174. https://doi.org/10.4094/chnr.2019.25.2.165ArticlePubMedPMC
- 19. Tsetsi E, Rains SA. Smartphone internet access and use: Extending the digital divide fand usage gap. Mobile Media & Communication. 2017;5(3):239–255. https://doi.org/10.1177/2050157917708329Article
- 20. Kwak JY, Kim JY, Yoon YW. Effect of parental neglect on smartphone addiction in adolescents in South Korea. Child Abuse & Neglect. 2018;77:75–84. https://doi.org/10.1016/j.chiabu.2017.12.008ArticlePubMed
- 21. Sun R, Gao Q, Xiang Y, Chen T, Liu T, Chen Q. Parent–child relationships and mobile phone addiction tendency among Chinese adolescents: The mediating role of psychological needs satisfaction and the moderating role of peer relationships. Children and Youth Services Review. 2020;116:105113. https://doi.org/10.1016/j.childyouth.2020.105113Article
- 22. Kwon HM, Kim BR. A comparative study of the influencing factors of smartphone dependence between elementary and middle school students. The Journal of The Korea Contents Association. 2022;22(10):827–839. https://doi.org/10.5392/JKCA.2022.22.10.827Article
- 23. Cho BH, Lim KH. Development and validation of emotional or behavioral problems scale. The Korean Journal of Counseling and Psychotherapy. 2003;15(4):729–746.
- 24. Kim KY. Development of behavior problem scale for children and adolescence. Journal of Families and Better Life. 1998;16(4):155–166.
- 25. Kim KI, Kim JH, Won HT. Symptom Checklist-90-Revision - Depression. In: Jung Ang Juk Sung Publisher. Korean manual of symptom checklist-90-revision. 1st ed. Seoul: Jung Ang Juk Sung Publisher; 1984. p.8-10.
- 26. Yeom YO, Hong YP, Kim KM, Lee YL, Lim MH. The relationships between academic burnout, mental health, parental achievement pressure, and academic demand in high school students. Stress. 2020;28(2):61–67. https://doi.org/10.17547/kjsr.2020.28.2.61Article
- 27. Bae SM, Hong JY, Hyun MH. A validation study of the peer relationship quality scale for adolescents. Korean Journal of Youth Studies. 2015;22(5):325–344.
- 28. Lee MY. Effects of parenting attitudes on smartphone addiction of adolescents: Mediator effects of peer & teacher relationship. Forum for Youth Culture. 2022;70:69–98. https://doi.org/10.17854/ffyc.2022.04.70.69Article
- 29. Kim JB, Kim NH. Validation of student-teacher attachment relationship scale (STARS) as a basis for evaluating teachers` educational competencies. The Korean Journal of Educational Psychology. 2009;23(4):697–714.
- 30. Kim TM, Lee EJ. Validation of the Korean version of parents as social context questionnaire for adolescents: PSCQ_KA. Korean Journal of Youth Studies. 2017;24(3):313–333. https://doi.org/10.21509/KJYS.2017.03.24.3.313Article
- 31. Kim S, Ahn DH. Influences of parenting styles on middle school students’ depression: Mediating effects of academic helplessness and social withdrawal. Korean Education Inquiry. 2021;39(3):177–203. https://doi.org/10.22327/kei.2021.39.3.177Article
- 32. Bai SY, Kim H, Sung E. 2013 youth media use survey report. Seoul: Ministry of Gender Equality and Family, 2013. Report No.: 2013-R28.
- 33. Ministry of Culture, Sports and Tourism. 2021 National Leisure Activities Survey [Internet]. Seoul: Ministry of Culture, Sports and Tourism, 2022 [cited 2023 Jun 12]. Available from: http://www.mcst.go.kr/kor/s_policy/dept/deptView.jsp?pSeq=1898&pDataCD=0406000000
- 34. Nylund KL, Asparouhov T, Muthén BO. Deciding on the number of classes in latent class analysis and growth mixture modeling: A Monte Carlo simulation study. Structural Equation Modeling: A Multidisciplinary Journal. 2007;14(4):535–569. https://doi.org/10.1080/10705510701575396Article
- 35. Pastor DA, Barron KE, Miller BJ, Davis SL. A latent profile analysis of college students’ achievement goal orientation. Contemporary Educational Psychology. 2007;32(1):8–47. https://doi.org/10.1016/j.cedpsych.2006.10.003Article
- 36. Clark SL, Muthén B. Relating latent class analysis results to variables not included in the analysis: the analysis. 2009 [cited 2023 Jun 16]. Available from: http://www.statmodel.com/download/relatinglca.pdf
- 37. Armstrong RA. When to use the Bonferroni correction. Ophthalmic and Physiological Optics. 2014;34(5):502–508. https://doi.org/10.1111/opo.12131ArticlePubMed
- 38. Resnikoff AW, Nugent NR. Social media use: What are adolescents communicating? The Brown University Child and Adolescent Behavior Letter. 2021;37(6):1–6. https://doi.org/10.1002/cbl.30546ArticlePMC
- 39. Bae SM. Influence of smartphone usage types and excessive expectation for smartphone on adolescents’ smartphone overdependence. Informatization Policy. 2018;25(4):65–83. http://doi.org/10.22693/NIAIP.2018.25.4.065Article
- 40. Min JS, Kim ES. A study on game usage motivation affecting game addiction: Focusing on mediation effect of future maturity. Korean Journal of Social Science. 2018;37(1):55–80. https://doi.org/10.18284/jss.2018.04.37.1.55Article
- 41. Throuvala MA, Griffiths MD, Rennoldson M, Kuss DJ. Motivational processes and dysfunctional mechanisms of social media use among adolescents: A qualitative focus group study. Computers in Human Behavior. 2019;93:164–175. https://doi.org/10.1016/j.chb.2018.12.012Article
- 42. Miranti A. Visual hyper reality of teenagers in social media with photographs as communication media. KnE Social Sciences. 2017;2(4):329–333. https://doi.org/10.18502/kss.v2i4.904Article
- 43. Becker SP, Fite PJ, Luebbe AM, Stoppelbein L, Greening L. Friendship intimacy exchange buffers the relation between ADHD symptoms and later social problems among children attending an after-school care program. Journal of Psychopathology and Behavioral Assessment. 2013;35:142–152. https://doi.org/10.1007/S10862-012-9334-1Article
- 44. Maurizi LK, Grogan-Kaylor A, Granillo MT, Delva J. The role of social relationships in the association between adolescents' depressive symptoms and academic achievement. Children and Youth Services Review. 2013;35(4):618–625. https://doi.org/10.1016/J.CHILDYOUTH.2013.01.006ArticlePubMedPMC
- 45. Rubin KH, Bowker J, Gazelle H. Social withdrawal in childhood and adolescence: Peer relationships and social competence. In: Rubin KH, Coplan RJ, editors. The development of shyness and social withdrawal. NY: The Guilford Press; 2010. p. 131–156.
- 46. Jassogne C, Zdanowicz N. Real or virtual relationships: Does it matter to teens? Psychiatria Danubina. 2020;32(suppl. 1):172–175.
- 47. Jensen M, George MJ, Russell MA, Lippold MA, Odgers CL. Does adolescent digital technology use detract from the parent–adolescent relationship? Journal of Research on Adolescence. 2021;31(2):469–481. https://doi.org/10.1111/jora.12618ArticlePubMedPMC
- 48. Asghari BA. Relationship between internet addiction and dependency virtual social networks with loneliness in adolescents. Journal of Research and Health. 2018;8(5):442–450. https://doi.org/10.29252/JRH.8.5.442Article
- 49. Lo SK, Wang CC, Fang W. Physical interpersonal relationships and social anxiety among online game players. Cyberpsychology & Behavior. 2005;8(1):15–20. https://doi.org/10.1089/cpb.2005.8.15ArticlePubMed
- 50. Hari J. Stolen Focus: Why You Can't Pay Attention. London, UK: Bloomsbury Publishing; 2022. 368 p.
- 51. Kent S, Masterson C, Ali R, Parsons CE, Bewick BM. Digital intervention for problematic smartphone use. International Journal of Environmental Research and Public Health. 2021;18(24):13165. https://doi.org/10.3390/ijerph182413165ArticlePubMedPMC
- 52. Kim E, Son HD, Choi MO, Jeong B. Development of a smartphone overdependence prevention group program in adolescents. Asia-Pacific Journal of Convergent Research Interchange. 2019;5(4):123–137. https://doi.org/10.21742/apjcri.2019.12.13Article
- 53. Marini L, Hendriani W, Wulandari PY. Optimizing the role of the family in prevention teen smartphone addiction through psychoeducation smartphone addiction to parents. Dinamisia: Jurnal Pengabdian Kepada Masyarakat. 2023;7(4):930–941. https://doi.org/10.31849/dinamisia.v7i4.15217Article
- 54. Eide TA, Aarestad SH, Andreassen CS, Bilder RM, Pallesen S. Smartphone restriction and its effect on subjective withdrawal related scores. Frontiers in Psychology. 2018;9:1444. https://doi.org/10.3389/fpsyg.2018.01444ArticlePubMedPMC
 PubReader
 ePub Link
 Cite
Cite

